

Wadhwani AI - Tuberculosis Cascade
Project Details
INFORGRAPHIC DESIGN, CREATIVE DATA VISUALISATION
Duration : 1-2 WEEKS
Agency
THOUGHT OVER DESIGN
Creative Director
ANUSHKA SANI
Design Lead
MEHAK GARG
Design Consultant
ROHIT DASGUPTA
Clients
WADHWANI AI
Introduction
The Wadhwani Institute for Artificial Intelligence is an independent, non-profit research institute, developing AI solutions for social good.
Their aim is to work with governments, social sector organisations, other innovators, and other relevant stakeholders to transform the lives of the billions of underserved people in India and the rest of the world.
CLIENT BRIEF: TO DESIGN A CLEAR AND COMPREHENSIBLE INFOGRAPHIC

About the TB Initiative
Tuberculosis (TB) is a curable and preventable airborne disease that usually affects the lungs. In 2019, 2.6 million new cases and 440,000 TB-related deaths were reported in India, which continues to have the highest burden (26%) of all TB cases in the world.
As an official AI partner of the Central TB Division (CTD), we are developing multiple interventions across the TB care cascade and helping India’s National TB Elimination Programme (NTEP) become AI-ready.

Existing Visualisation

In Numbers
Objective
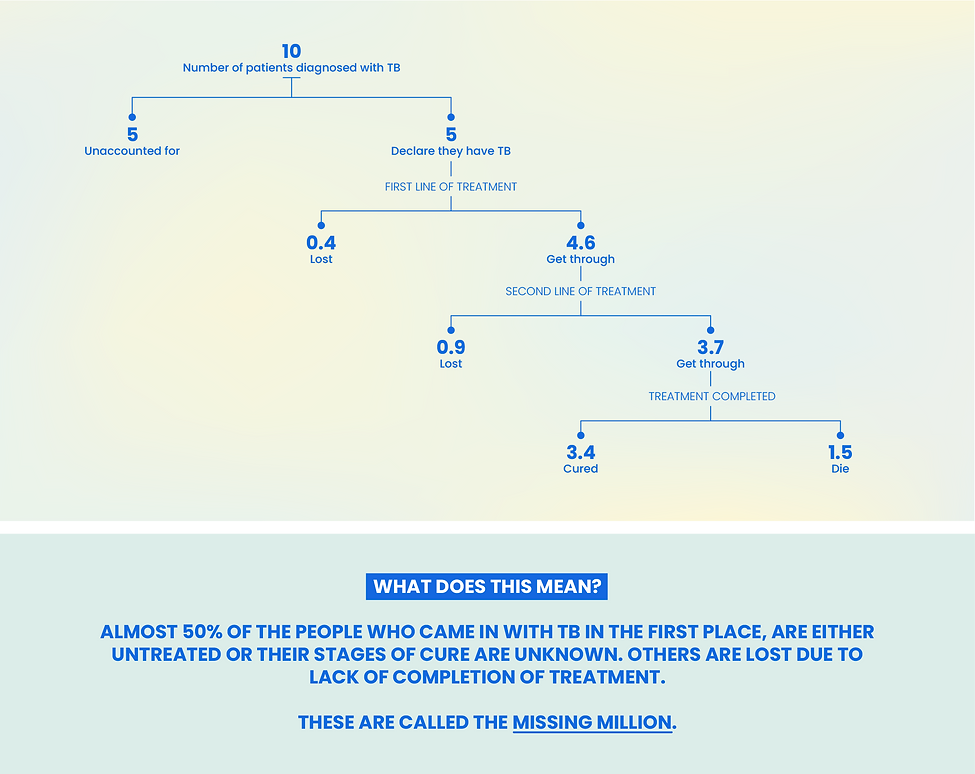
To show graphically, the process through which TB patients are identified and pass through the layers through which several patients drop out. Leaving not only themselves but also the larger population at risk.
Representation Routes

Initial Versions

Final Version


Learning Outcome
CREATIVE DATA VISUALISATION
Data visualisation doesn’t always mean use of graphs or charts, other innovative and creative ways to depict data makes the infographic a lot more intriguing, and can communicate information very effectively. It has the power to maintain the attention of the user for much longer and engage them by providing information through multiple easy to grasp layers.